

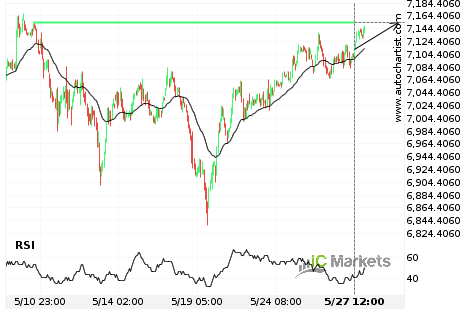
A final push expected on Australia 200 Index
Australia 200 Index is heading towards a price line of 7153.8599 and could reach this point within the next 3 days. It has tested this line numerous times in the past, and this time could be no different from the past, ending in a rebound instead of a breakout. If the breakout doesn’t happen, we […]
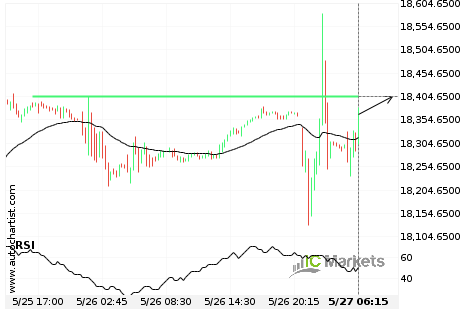
Should we expect a breakout or a rebound on FTSE China A50 Index?
The movement of FTSE China A50 Index towards 18404.3008 price line is yet another test of the line it reached numerous times in the past. We expect this line test to happen in the next 7 hours, but it is uncertain whether it will result in a breakout through this line, or simply rebound back […]
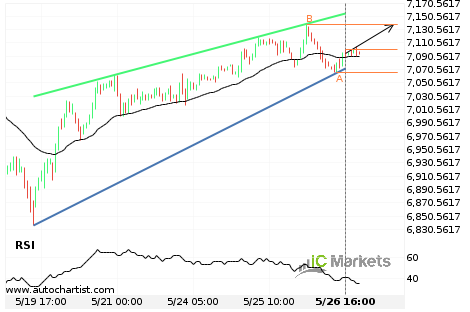
Australia 200 Index – getting close to resistance of a Rising Wedge
Australia 200 Index is moving towards the resistance line of a Rising Wedge. Because we have seen it retrace from this line before, we could see either a break through this line, or a rebound back to current levels. It has touched this line numerous times in the last 8 days and may test it […]
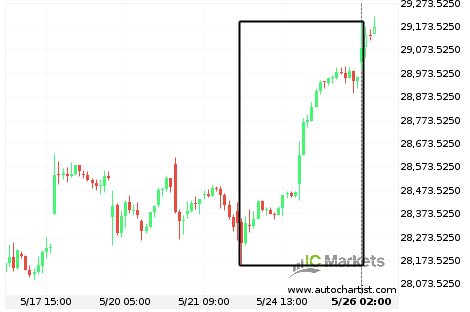
Hong Kong 50 Index is on its way up
Hong Kong 50 Index has experienced an exceptionally large movement higher by 2.95% from 28,333.4 to 29,081.1 in the last 3 days.
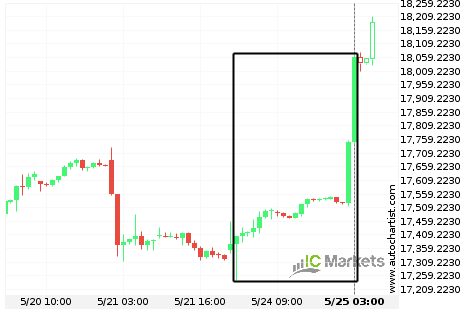
Huge bullish move on FTSE China A50 Index
FTSE China A50 Index has moved higher by 3.76% from 17,373.22 to 18,059.04 in the last 2 days.
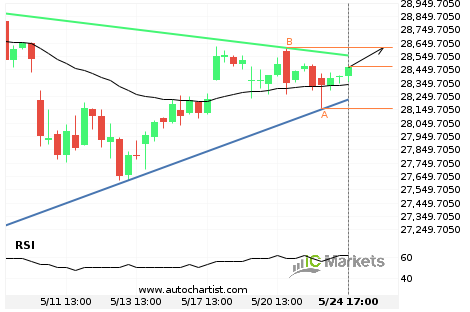
Hong Kong 50 Index – getting close to resistance of a Triangle
Hong Kong 50 Index is moving towards the resistance line of a Triangle. Because we have seen it retrace from this line before, we could see either a break through this line, or a rebound back to current levels. It has touched this line numerous times in the last 15 days and may test it […]
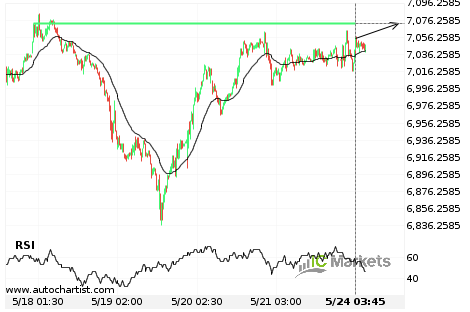
Australia 200 Index approaching important 7071.9102 price line
Australia 200 Index is approaching the resistance line of a Resistance. It has touched this line numerous times in the last 7 days. If it tests this line again, it should do so in the next 19 hours.